Single Stock Trading
Deep Reinforcement Learning for Stock Trading from Scratch: Single Stock Trading
Tip
Run the code step by step at Google Colab.
Step 1: Preparation
Step 1.1: Overview
As deep reinforcement learning (DRL) has been recognized as an effective approach in quantitative finance, getting hands-on experiences is attractive to beginners. However, to train a practical DRL trading agent that decides where to trade, at what price, and what quantity involves error-prone and arduous development and debugging.
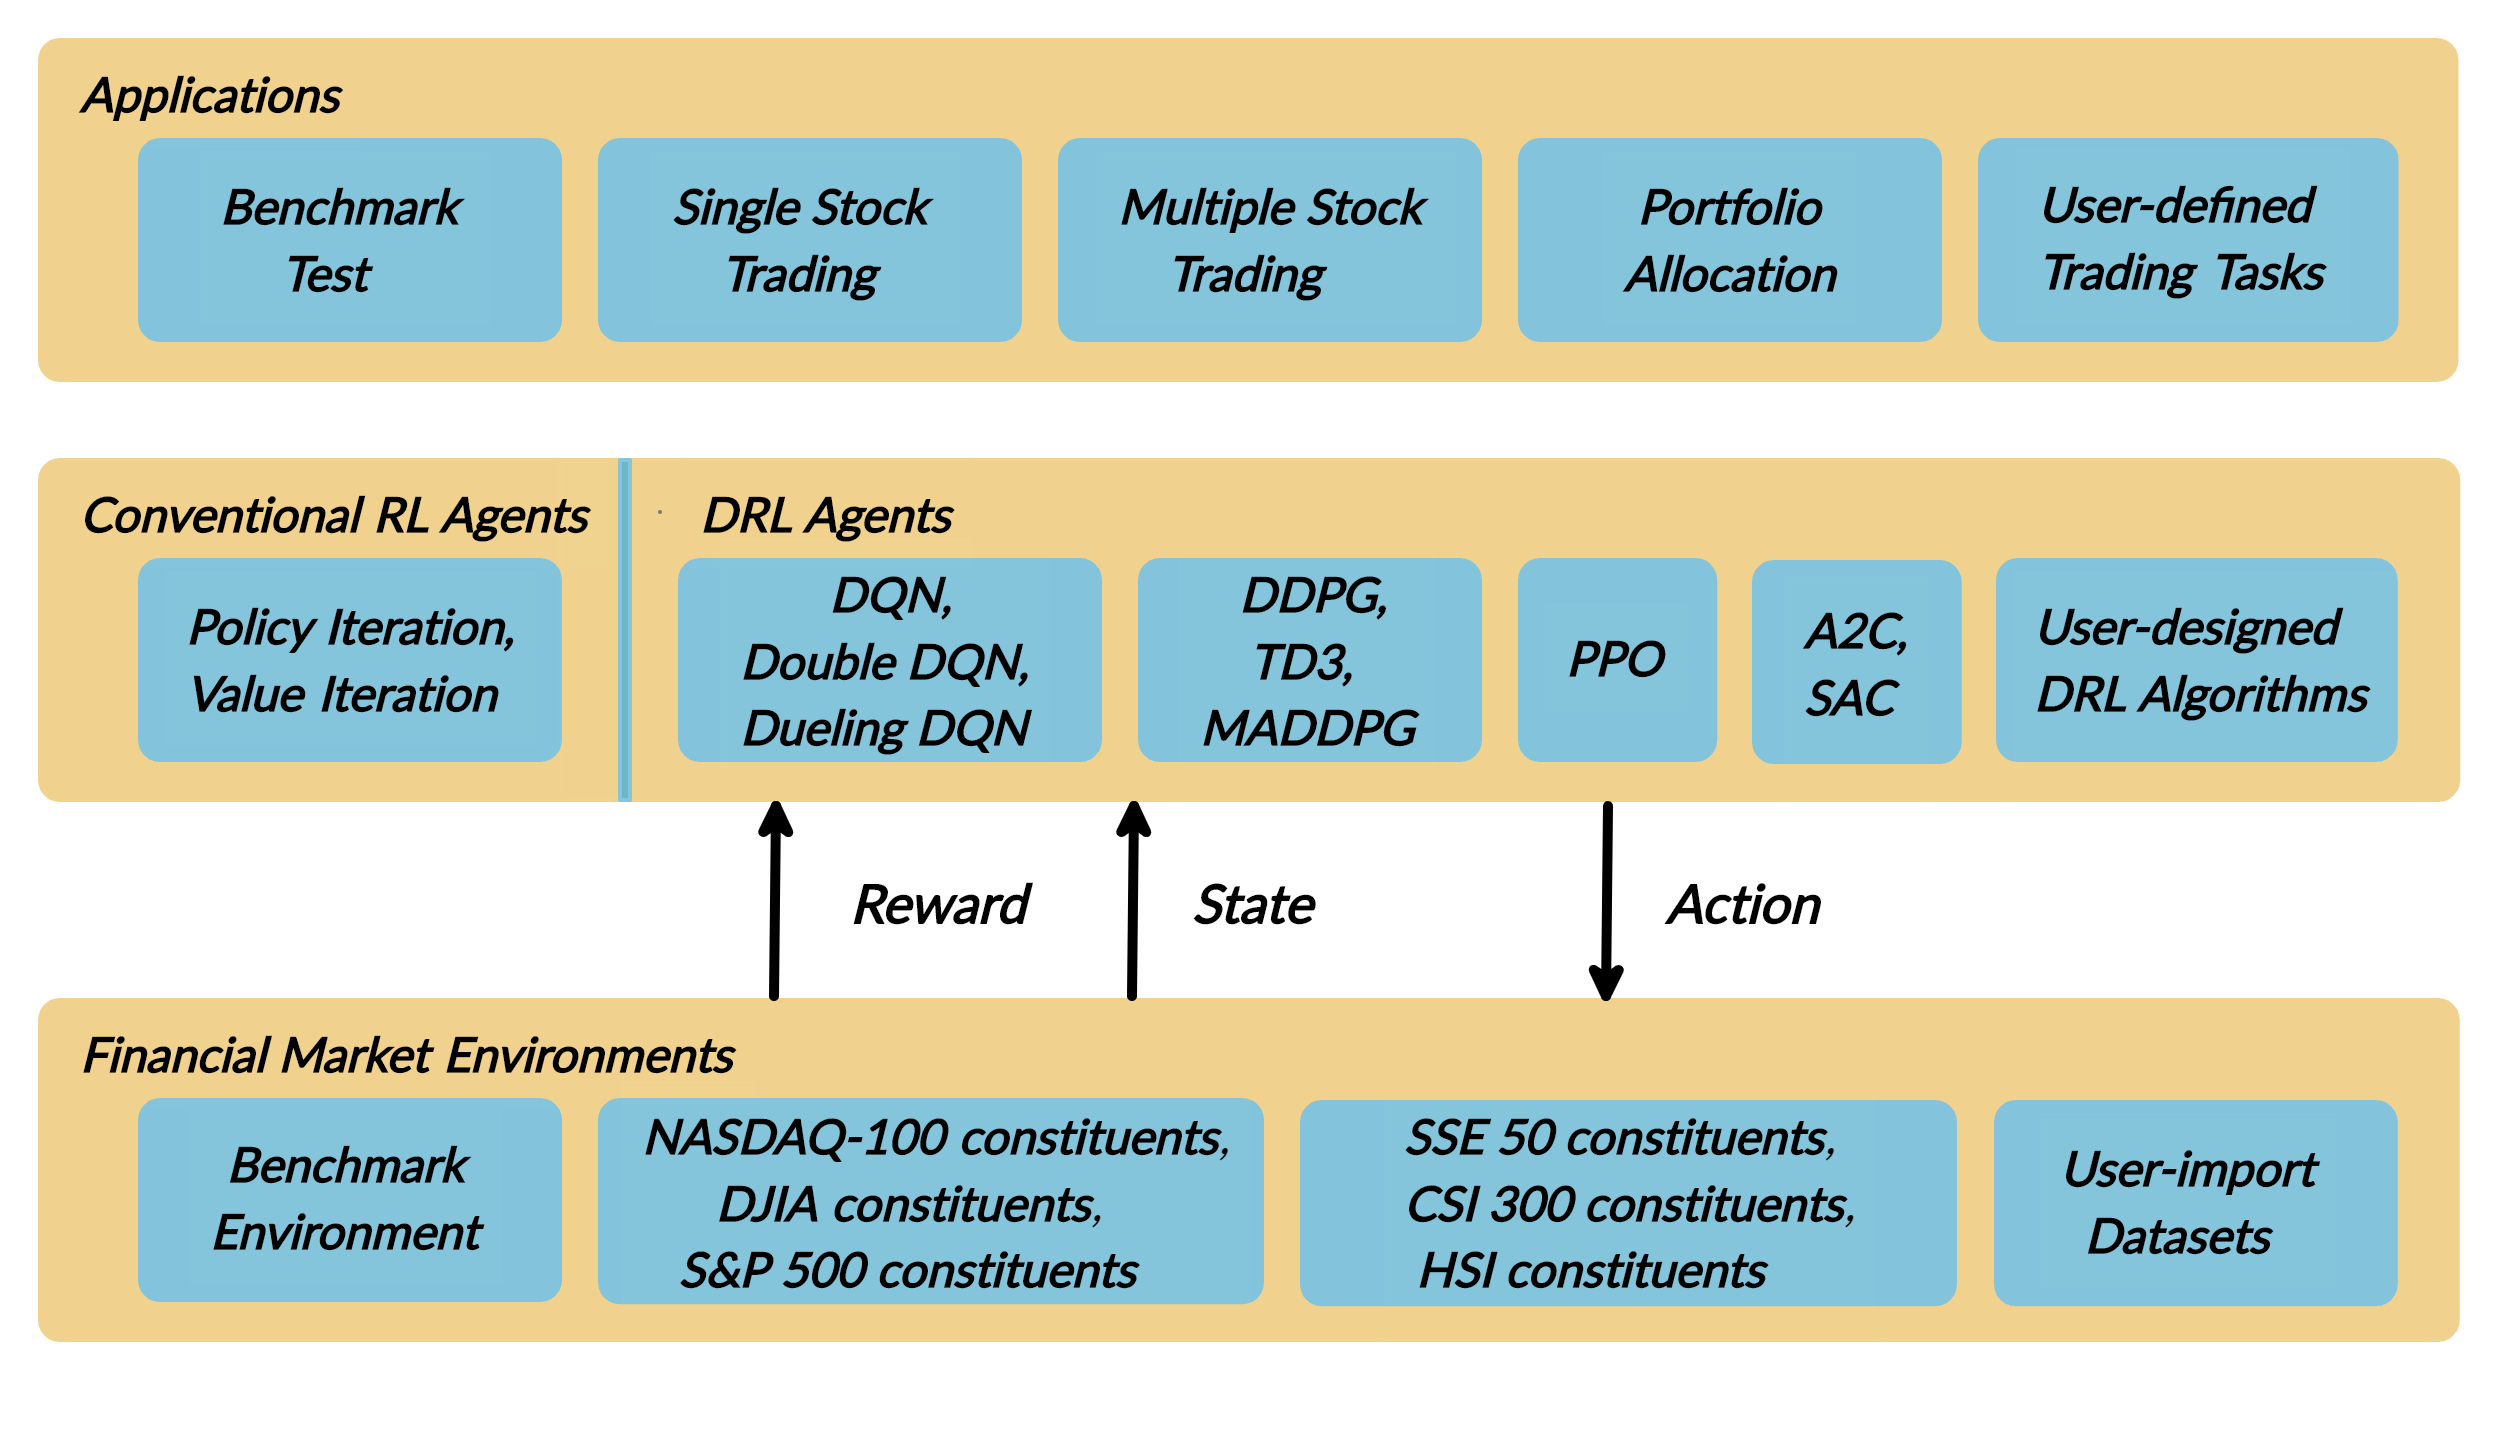
We introduce a DRL library FinRL that facilitates beginners to expose themselves to quantitative finance and to develop their own stock trading strategies. Along with easily-reproducible tutorials, FinRL library allows users to streamline their own developments and to compare with existing schemes easily.
FinRL is a beginner-friendly library with fine-tuned standard DRL algorithms. It has been developed under three primary principles:
Completeness: Our library shall cover components of the DRL framework completely, which is a fundamental requirement;
Hands-on tutorials: We aim for a library that is friendly to beginners. Tutorials with detailed walk-through will help users to explore the functionalities of our library;
Reproducibility: Our library shall guarantee reproducibility to ensure the transparency and also provide users with confidence in what they have done
This article is focusing on one of the use cases in our paper: Single Stock Trading. We use one Jupyter notebook to include all the necessary steps.
We use Apple Inc. stock: AAPL as an example throughout this article, because it is one of the most popular stocks.
Step 1.2: Problem Definition
This problem is to design an automated trading solution for single stock trading. We model the stock trading process as a Markov Decision Process (MDP). We then formulate our trading goal as a maximization problem.
The components of the reinforcement learning environment are:
Action: The action space describes the allowed actions that the agent interacts with the environment. Normally, a ∈ A includes three actions: a ∈ {−1, 0, 1}, where −1, 0, 1 represent selling, holding, and buying one stock. Also, an action can be carried upon multiple shares. We use an action space {−k, …, −1, 0, 1, …, k}, where k denotes the number of shares. For example, “Buy 10 shares of AAPL” or “Sell 10 shares of AAPL” are 10 or −10, respectively
Reward function: r(s, a, s′) is the incentive mechanism for an agent to learn a better action. The change of the portfolio value when action a is taken at state s and arriving at new state s’, i.e., r(s, a, s′) = v′ − v, where v′ and v represent the portfolio values at state s′ and s, respectively
State: The state space describes the observations that the agent receives from the environment. Just as a human trader needs to analyze various information before executing a trade, so our trading agent observes many different features to better learn in an interactive environment.
Environment: single stock trading for AAPL
The data of the single stock that we will be using for this case study is obtained from Yahoo Finance API. The data contains Open-High-Low-Close price and volume.
Step 1.3: Python Package Installation
As a first step we check if the additional packages needed are present, if not install them.
Yahoo Finance API
pandas
matplotlib
stockstats
OpenAI gym
stable-baselines
tensorflow
 1import pkg_resources
 2import pip
 3installedPackages = {pkg.key for pkg in pkg_resources.working_set}
 4required = {'yfinance', 'pandas', 'matplotlib', 'stockstats','stable-baselines','gym','tensorflow'}
 5missing = required - installedPackages
 6if missing:
 7    !pip install yfinance
 8    !pip install pandas
 9    !pip install matplotlib
10    !pip install stockstats
11    !pip install gym
12    !pip install stable-baselines[mpi]
13    !pip install tensorflow==1.15.4
Step 1.4: Import packages
 1import yfinance as yf
 2from stockstats import StockDataFrame as Sdf
 3
 4import pandas as pd
 5import matplotlib.pyplot as plt
 6
 7import gym
 8from stable_baselines import PPO2, DDPG, A2C, ACKTR, TD3
 9from stable_baselines import DDPG
10from stable_baselines import A2C
11from stable_baselines import SAC
12from stable_baselines.common.vec_env import DummyVecEnv
13from stable_baselines.common.policies import MlpPolicy
Step 2: Download Data
Yahoo Finance is a website that provides stock data, financial news, financial reports, etc. All the data provided by Yahoo Finance is free.
This Medium blog explains how to use Yahoo Finance API to extract data directly in Python.
FinRL uses a class YahooDownloader to fetch data from Yahoo Finance API
Call Limit: Using the Public API (without authentication), you are limited to 2,000 requests per hour per IP (or up to a total of 48,000 requests a day).
We can either download the stock data like open-high-low-close price manually by entering a stock ticker symbol like AAPL into the website search bar, or we just use Yahoo Finance API to extract data automatically.
FinRL uses a YahooDownloader class to extract data.
class YahooDownloader:
    """
    Provides methods for retrieving daily stock data from Yahoo Finance API

    Attributes
    ----------
        start_date : str
            start date of the data (modified from config.py)
        end_date : str
            end date of the data (modified from config.py)
        ticker_list : list
            a list of stock tickers (modified from config.py)

    Methods
    -------
        fetch_data()
            Fetches data from yahoo API
    """
Download and save the data in a pandas DataFrame:
1 # Download and save the data in a pandas DataFrame:
2 df = YahooDownloader(start_date = '2009-01-01',
3                           end_date = '2020-09-30',
4                           ticker_list = config_tickers.DOW_30_TICKER).fetch_data()
5
6 print(df.sort_values(['date','tic'],ignore_index=True).head(30))

Step 3: Preprocess Data
Data preprocessing is a crucial step for training a high quality machine learning model. We need to check for missing data and do feature engineering in order to convert the data into a model-ready state.
FinRL uses a FeatureEngineer class to preprocess the data
Add technical indicators. In practical trading, various information needs to be taken into account, for example the historical stock prices, current holding shares, technical indicators, etc.
Calculate technical indicators
In practical trading, various information needs to be taken into account, for example the historical stock prices, current holding shares, technical indicators, etc.
FinRL uses stockstats to calcualte technical indicators such as Moving Average Convergence Divergence (MACD), Relative Strength Index (RSI), Average Directional Index (ADX), Commodity Channel Index (CCI) and other various indicators and stats.
stockstats: supplies a wrapper StockDataFrame based on the pandas.DataFrame with inline stock statistics/indicators support.
we store the stockstats technical indicator column names in config.py
config.INDICATORS = [‘macd’, ‘rsi_30’, ‘cci_30’, ‘dx_30’]
User can add more technical indicators, check https://github.com/jealous/stockstats for different names
FinRL uses a FeatureEngineer class to preprocess data.
class FeatureEngineer:
    """
    Provides methods for preprocessing the stock price data

    Attributes
    ----------
        df: DataFrame
            data downloaded from Yahoo API
        feature_number : int
            number of features we used
        use_technical_indicator : boolean
            we technical indicator or not
        use_turbulence : boolean
            use turbulence index or not

    Methods
    -------
        preprocess_data()
            main method to do the feature engineering
    """
Perform Feature Engineering:
1 # Perform Feature Engineering:
2 df = FeatureEngineer(df.copy(),
3                      use_technical_indicator=True,
4                      tech_indicator_list = config.INDICATORS,
5                      use_turbulence=True,
6                      user_defined_feature = False).preprocess_data()
Step 4: Build Environment
Considering the stochastic and interactive nature of the automated stock trading tasks, a financial task is modeled as a Markov Decision Process (MDP) problem. The training process involves observing stock price change, taking an action and reward’s calculation to have the agent adjusting its strategy accordingly. By interacting with the environment, the trading agent will derive a trading strategy with the maximized rewards as time proceeds.
Our trading environments, based on OpenAI Gym framework, simulate live stock markets with real market data according to the principle of time-driven simulation.
Environment design is one of the most important part in DRL, because it varies a lot from applications to applications and from markets to markets. We can’t use an environment for stock trading to trade bitcoin, and vice versa.
The action space describes the allowed actions that the agent interacts with the environment. Normally, action a includes three actions: {-1, 0, 1}, where -1, 0, 1 represent selling, holding, and buying one share. Also, an action can be carried upon multiple shares. We use an action space {-k,…,-1, 0, 1, …, k}, where k denotes the number of shares to buy and -k denotes the number of shares to sell. For example, “Buy 10 shares of AAPL” or “Sell 10 shares of AAPL” are 10 or -10, respectively. The continuous action space needs to be normalized to [-1, 1], since the policy is defined on a Gaussian distribution, which needs to be normalized and symmetric.
In this article, I set k=200, the entire action space is 200*2+1 = 401 for AAPL.
FinRL uses a EnvSetup class to setup environment.
class EnvSetup:

    """
    Provides methods for retrieving daily stock data from
    Yahoo Finance API

    Attributes
    ----------
        stock_dim: int
            number of unique stocks
        hmax : int
            maximum number of shares to trade
        initial_amount: int
            start money
        transaction_cost_pct : float
            transaction cost percentage per trade
        reward_scaling: float
            scaling factor for reward, good for training
        tech_indicator_list: list
            a list of technical indicator names (modified from config.py)
    Methods
    -------
        fetch_data()
            Fetches data from yahoo API
    """
Initialize an environment class:
 1 # Initialize env:
 2 env_setup = EnvSetup(stock_dim = stock_dimension,
 3                      state_space = state_space,
 4                      hmax = 100,
 5                      initial_amount = 1000000,
 6                      transaction_cost_pct = 0.001,
 7                      tech_indicator_list = config.INDICATORS)
 8
 9 env_train = env_setup.create_env_training(data = train,
10                                          env_class = StockEnvTrain)
User-defined Environment: a simulation environment class.
FinRL provides blueprint for single stock trading environment.
class SingleStockEnv(gym.Env):
    """
    A single stock trading environment for OpenAI gym

    Attributes
    ----------
        df: DataFrame
            input data
        stock_dim : int
            number of unique stocks
        hmax : int
            maximum number of shares to trade
        initial_amount : int
            start money
        transaction_cost_pct: float
            transaction cost percentage per trade
        reward_scaling: float
            scaling factor for reward, good for training
        state_space: int
            the dimension of input features
        action_space: int
            equals stock dimension
        tech_indicator_list: list
            a list of technical indicator names
        turbulence_threshold: int
            a threshold to control risk aversion
        day: int
            an increment number to control date

    Methods
    -------
        _sell_stock()
            perform sell action based on the sign of the action
        _buy_stock()
            perform buy action based on the sign of the action
        step()
            at each step the agent will return actions, then
            we will calculate the reward, and return the next
            observation.
        reset()
            reset the environment
        render()
            use render to return other functions
        save_asset_memory()
            return account value at each time step
        save_action_memory()
            return actions/positions at each time step
    """
Tutorial for how to design a customized trading environment will be pulished in the future soon.
Step 5: Implement DRL Algorithms
The implementation of the DRL algorithms are based on OpenAI Baselines and Stable Baselines. Stable Baselines is a fork of OpenAI Baselines, with a major structural refactoring, and code cleanups.
Tip
FinRL library includes fine-tuned standard DRL algorithms, such as DQN, DDPG, Multi-Agent DDPG, PPO, SAC, A2C and TD3. We also allow users to design their own DRL algorithms by adapting these DRL algorithms.
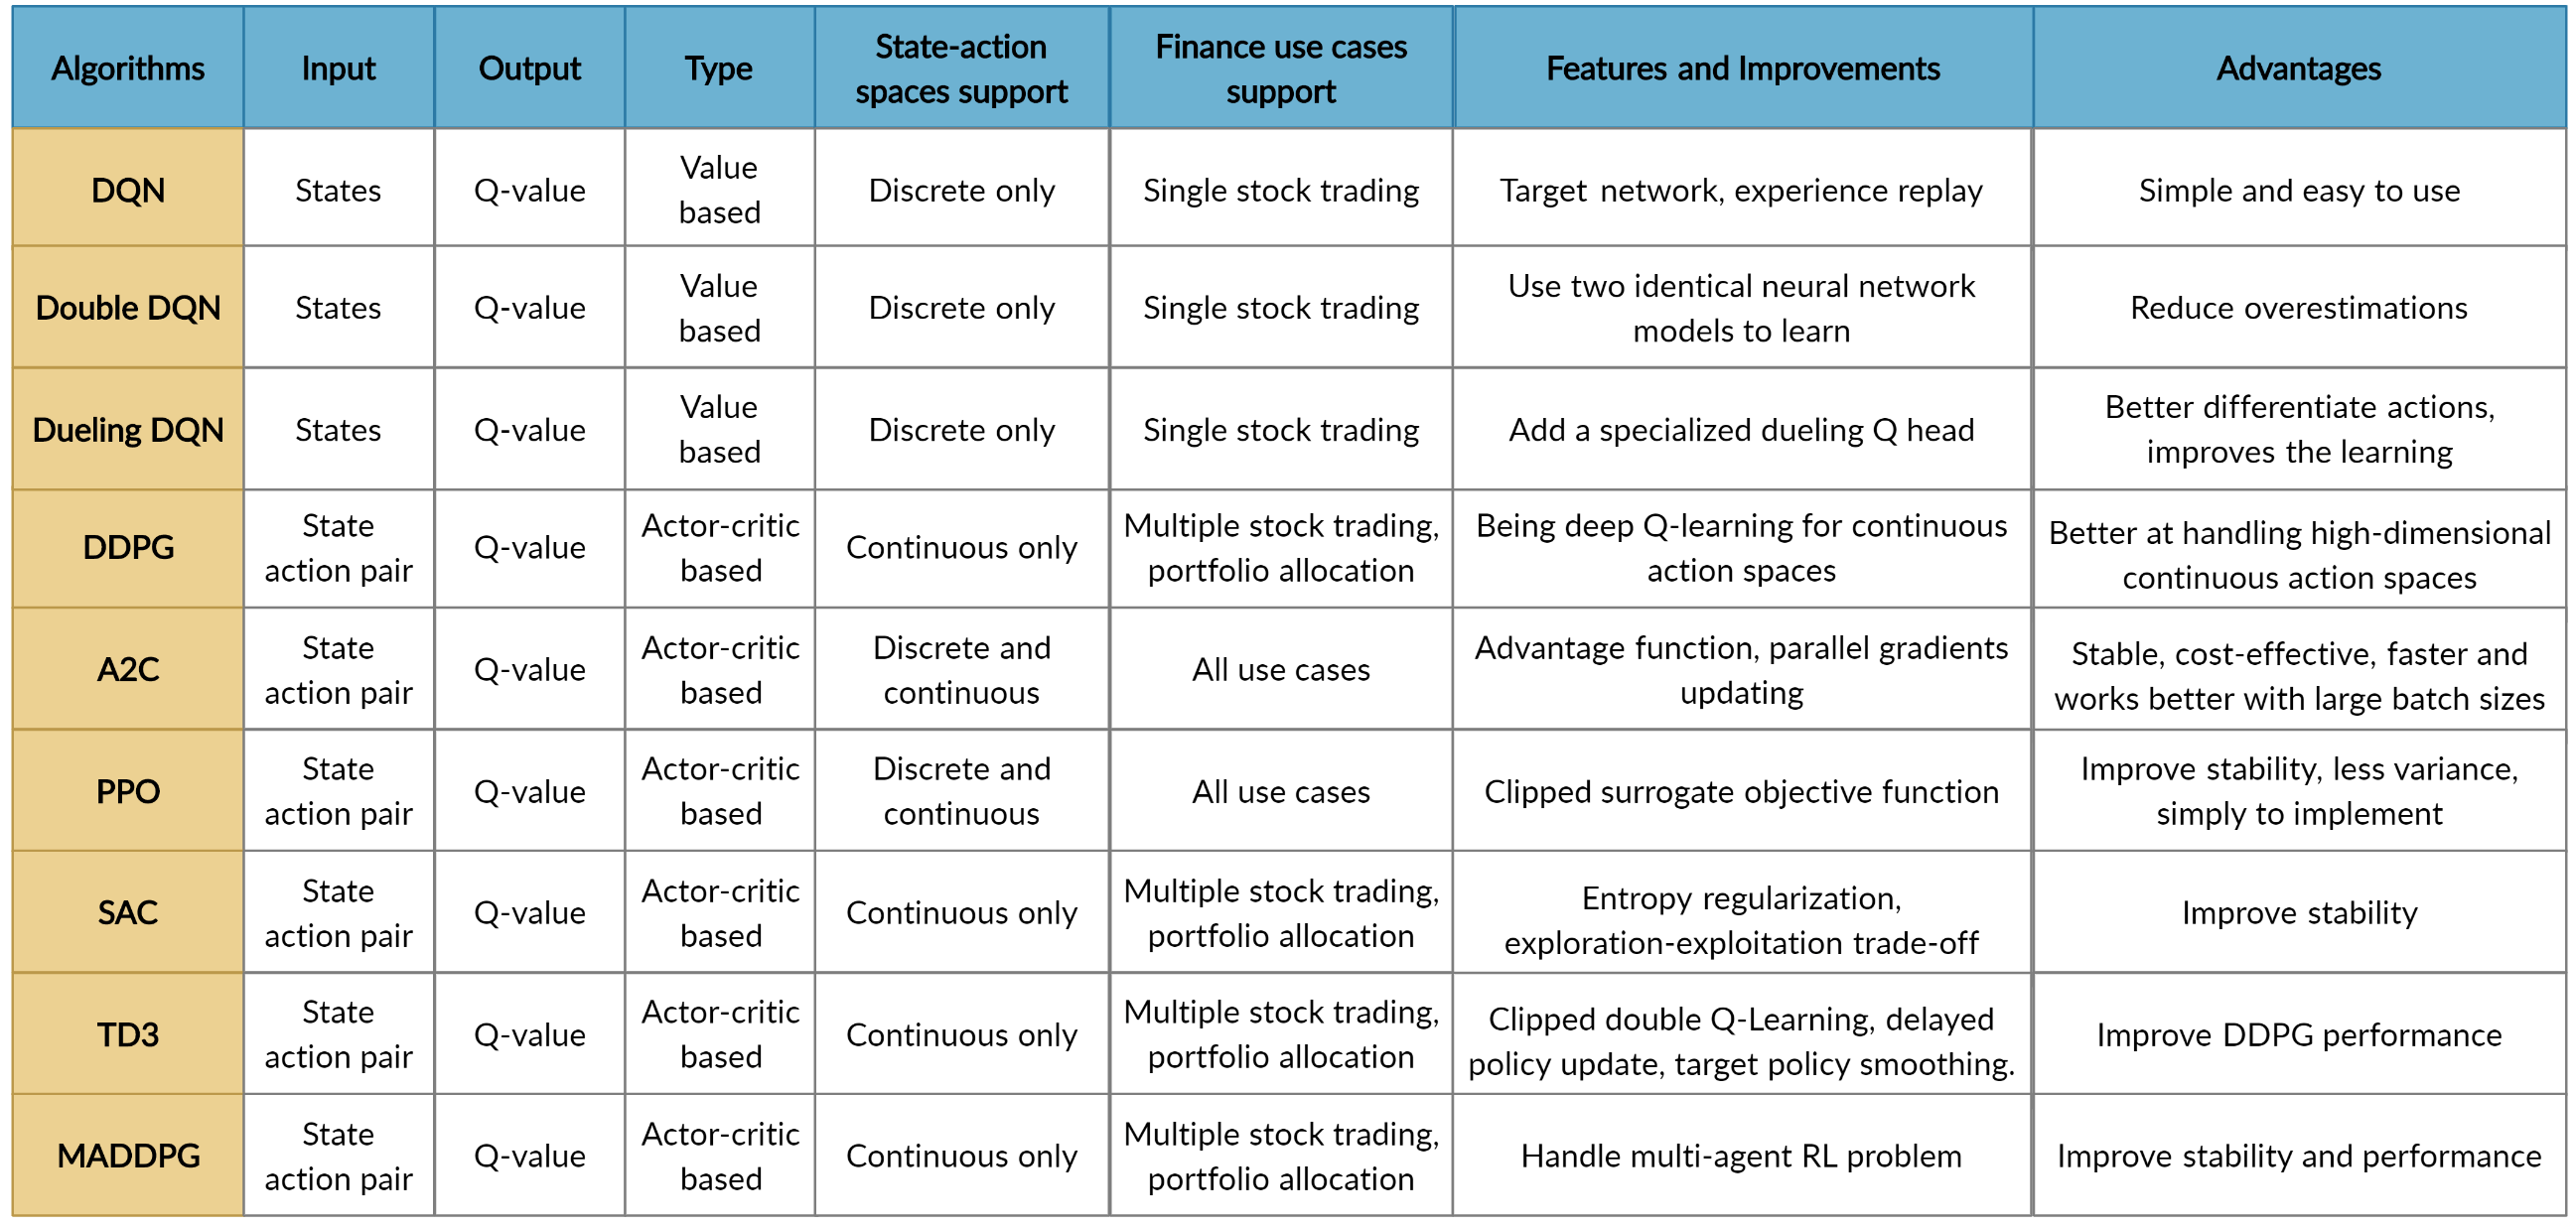
FinRL uses a DRLAgent class to implement the algorithms.
class DRLAgent:
    """
    Provides implementations for DRL algorithms

    Attributes
    ----------
        env: gym environment class
             user-defined class
    Methods
    -------
        train_PPO()
            the implementation for PPO algorithm
        train_A2C()
            the implementation for A2C algorithm
        train_DDPG()
            the implementation for DDPG algorithm
        train_TD3()
            the implementation for TD3 algorithm
        DRL_prediction()
            make a prediction in a test dataset and get results
    """
Step 6: Model Training
We use 5 DRL models in this article, namely PPO, A2C, DDPG, SAC and TD3. I introduced these models in the previous article. TD3 is an improvement over DDPG.
Tensorboard: reward and loss function plot We use tensorboard integration for hyperparameter tuning and model picking. Tensorboard generates nice looking charts.
Once the learn function is called, you can monitor the RL agent during or after the training, with the following bash command:
1 # cd to the tensorboard_log folder, run the following command
2 tensorboard --logdir ./A2C_20201127-19h01/
3 # you can also add past logging folder
4 tensorboard --logdir ./a2c_tensorboard/;./ppo2_tensorboard/
Total rewards for each of the algorithm:

total_timesteps (int): the total number of samples to train on. It is one of the most important hyperparameters, there are also other important parameters such as learning rate, batch size, buffer size, etc.
To compare these algorithms, I set the total_timesteps = 100k. If we set the total_timesteps too large, then we will face a risk of overfitting.
By observing the episode_reward chart, we can see that these algorithms will converge to an optimal policy eventually as the step grows. TD3 converges very fast.
actor_loss for DDPG and policy_loss for TD3:


Picking models
We pick the TD3 model, because it converges pretty fast and it’s a state of the art model over DDPG. By observing the episode_reward chart, TD3 doesn’t need to reach full 100k total_timesteps to converge.
Four models: PPO A2C, DDPG, TD3
Model 1: PPO
1#tensorboard --logdir ./single_stock_tensorboard/
2env_train = DummyVecEnv([lambda: SingleStockEnv(train)])
3model_ppo = PPO2('MlpPolicy', env_train, tensorboard_log="./single_stock_trading_2_tensorboard/")
4model_ppo.learn(total_timesteps=100000,tb_log_name="run_aapl_ppo")
5#model.save('AAPL_ppo_100k')
Model 2: DDPG
1#tensorboard --logdir ./single_stock_tensorboard/
2env_train = DummyVecEnv([lambda: SingleStockEnv(train)])
3model_ddpg = DDPG('MlpPolicy', env_train, tensorboard_log="./single_stock_trading_2_tensorboard/")
4model_ddpg.learn(total_timesteps=100000, tb_log_name="run_aapl_ddpg")
5#model.save('AAPL_ddpg_50k')
Model 3: A2C
1#tensorboard --logdir ./single_stock_tensorboard/
2env_train = DummyVecEnv([lambda: SingleStockEnv(train)])
3model_a2c = A2C('MlpPolicy', env_train, tensorboard_log="./single_stock_trading_2_tensorboard/")
4model_a2c.learn(total_timesteps=100000,tb_log_name="run_aapl_a2c")
5#model.save('AAPL_a2c_50k')
Model 4: TD3
1#tensorboard --logdir ./single_stock_tensorboard/
2#DQN<DDPG<TD3
3env_train = DummyVecEnv([lambda: SingleStockEnv(train)])
4model_td3 = TD3('MlpPolicy', env_train, tensorboard_log="./single_stock_trading_2_tensorboard/")
5model_td3.learn(total_timesteps=100000,tb_log_name="run_aapl_td3")
6#model.save('AAPL_td3_50k')
Testing data
1test = data_clean[(data_clean.datadate>='2019-01-01') ]
2# the index needs to start from 0
3test=test.reset_index(drop=True)
Trading
Assume that we have $100,000 initial capital at 2019-01-01. We use the TD3 model to trade AAPL.
1model = model_td3
2env_test = DummyVecEnv([lambda: SingleStockEnv(test)])
3obs_test = env_test.reset()
4print("==============Model Prediction===========")
5for i in range(len(test.index.unique())):
6    action, _states = model.predict(obs_test)
7    obs_test, rewards, dones, info = env_test.step(action)
8    env_test.render()
1 # create trading env
2 env_trade, obs_trade = env_setup.create_env_trading(data = trade,
3                                        env_class = StockEnvTrade,
4                                         turbulence_threshold=250)
5 ## make a prediction and get the account value change
6 df_account_value = DRLAgent.DRL_prediction(model=model_sac,
7                                            test_data = trade,
8                                            test_env = env_trade,
9                                            test_obs = obs_trade)

Step 7: Backtest Our Strategy
Backtesting plays a key role in evaluating the performance of a trading strategy. Automated backtesting tool is preferred because it reduces the human error. We usually use the `Quantopian pyfolio`_ package to backtest our trading strategies. It is easy to use and consists of various individual plots that provide a comprehensive image of the performance of a trading strategy.
For simplicity purposes, in the article, we just calculate the Sharpe ratio and the annual return manually.
 1def get_DRL_sharpe():
 2    df_total_value=pd.read_csv('account_value.csv',index_col=0)
 3    df_total_value.columns = ['account_value']
 4    df_total_value['daily_return']=df_total_value.pct_change(1)
 5    sharpe = (252**0.5)*df_total_value['daily_return'].mean()/ \
 6    df_total_value['daily_return'].std()
 7
 8    annual_return = ((df_total_value['daily_return'].mean()+1)**252-1)*100
 9    print("annual return: ", annual_return)
10    print("sharpe ratio: ", sharpe)
11    return df_total_value
12
13
14def get_buy_and_hold_sharpe(test):
15    test['daily_return']=test['adjcp'].pct_change(1)
16    sharpe = (252**0.5)*test['daily_return'].mean()/ \
17    test['daily_return'].std()
18    annual_return = ((test['daily_return'].mean()+1)**252-1)*100
19    print("annual return: ", annual_return)
20
21    print("sharpe ratio: ", sharpe)
22    #return sharpe